Cisco Dashboard
Networking Plan & Usage
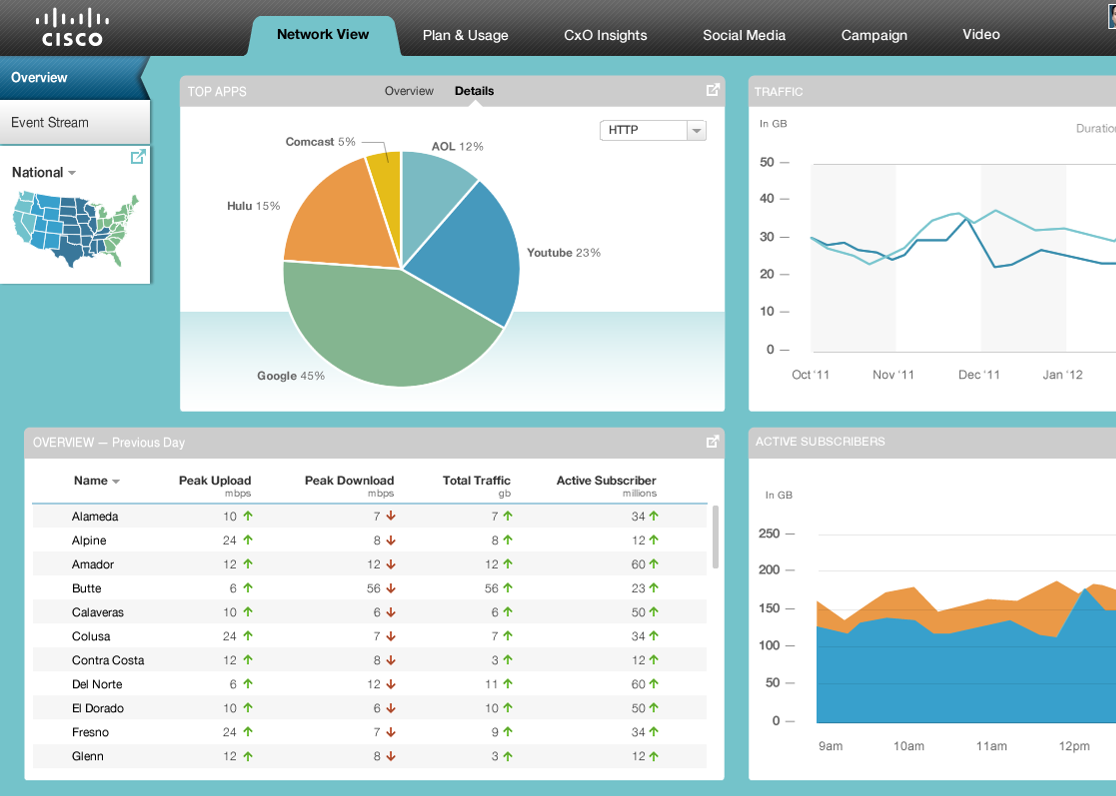
Overview
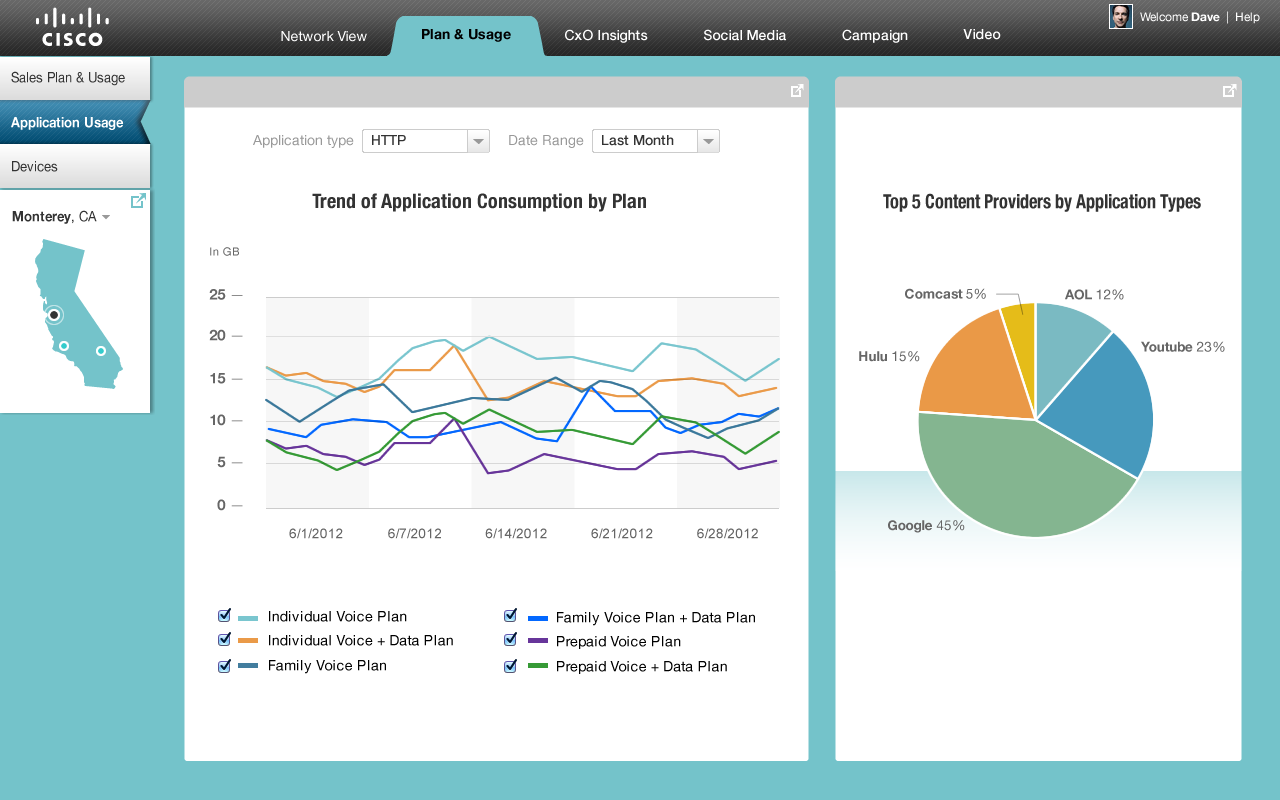
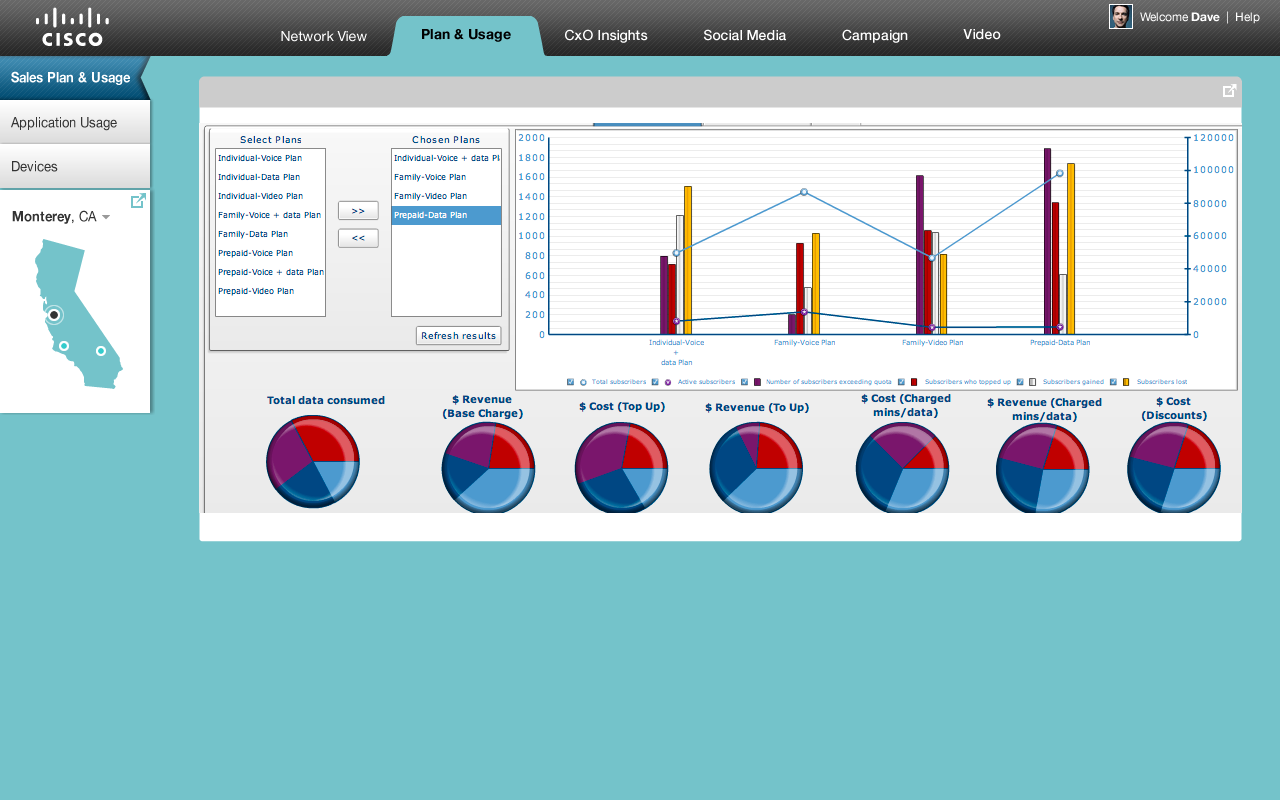
The Cisco internal development team was looking to have a dashboard with live feed of usage across their clients using their networking systems.
Goal
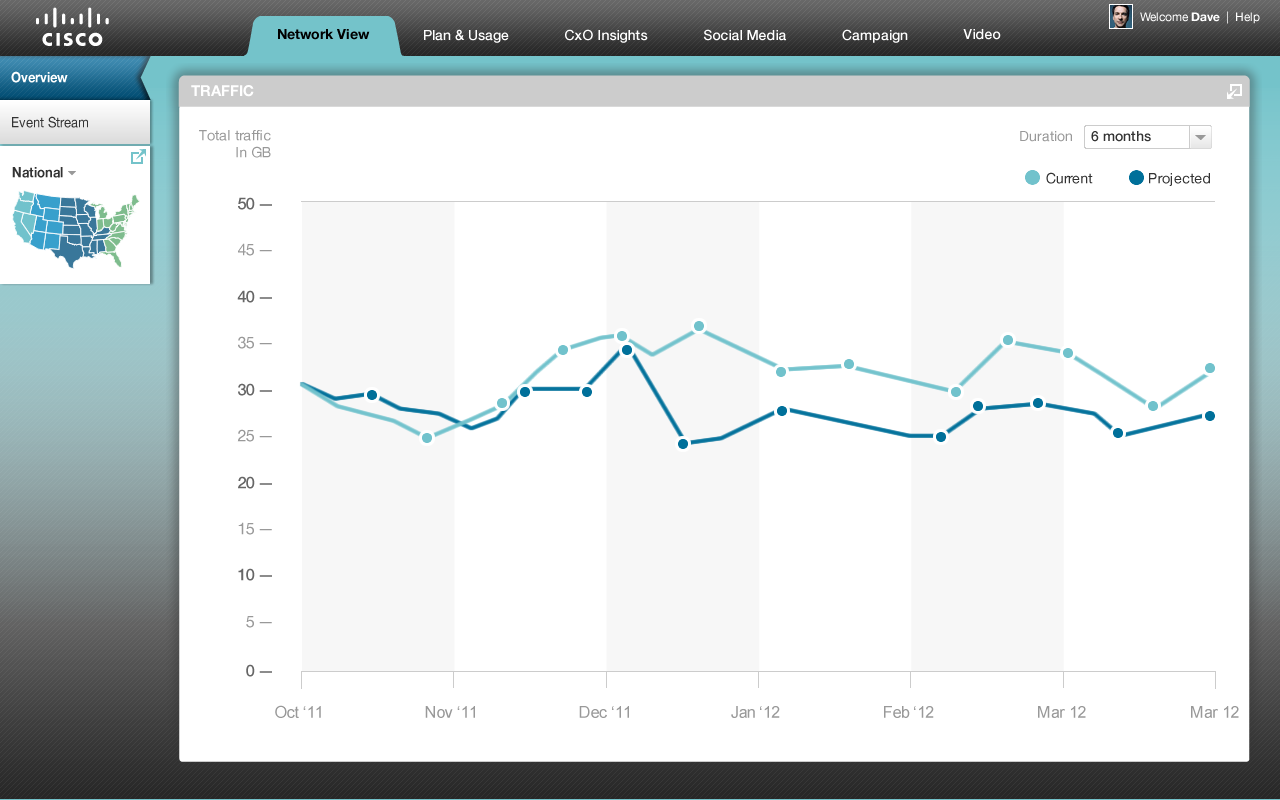
With data usage that can be tracked in real-time, engineers at Cisco can route the respective hardware and software support teams to accommodate data traffic optimizations.
Role
Strategy, Cross-team Collaboration, UI Designs, Visual design, Interaction deliverables
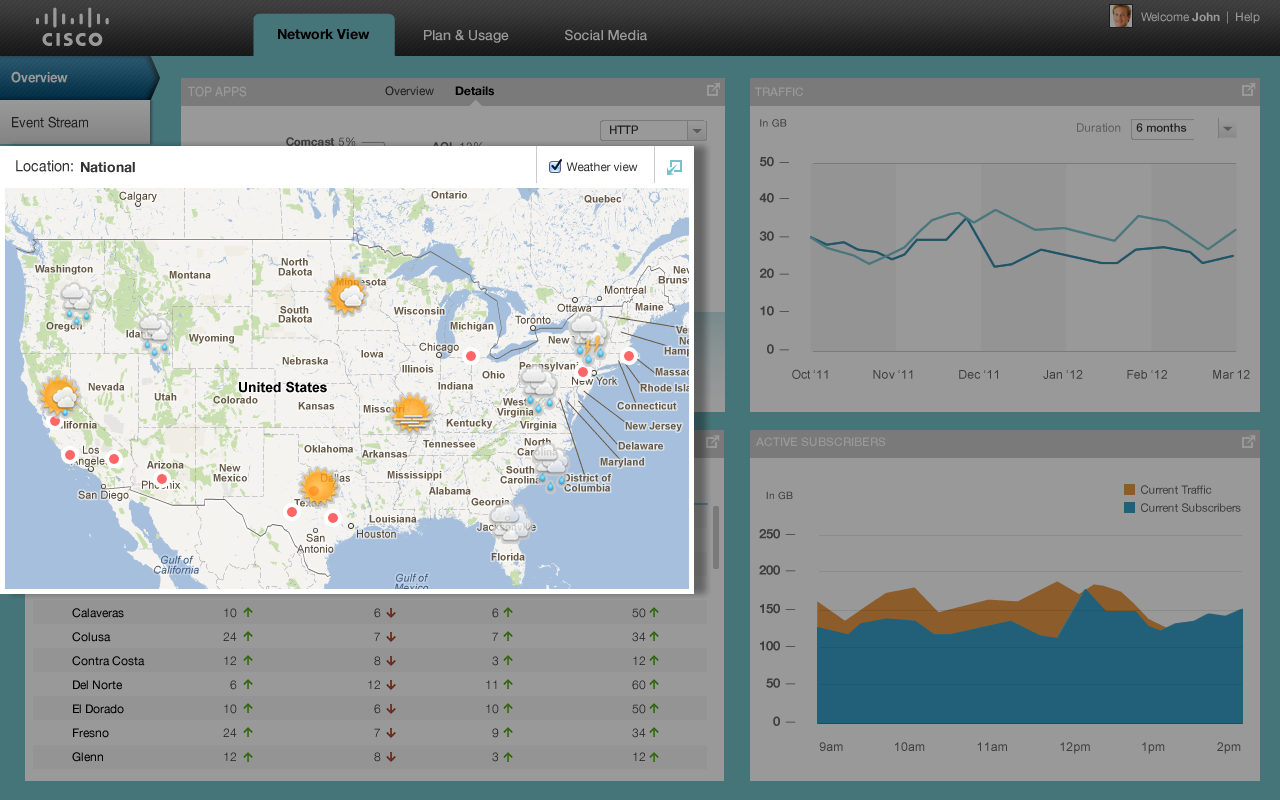
Map UI
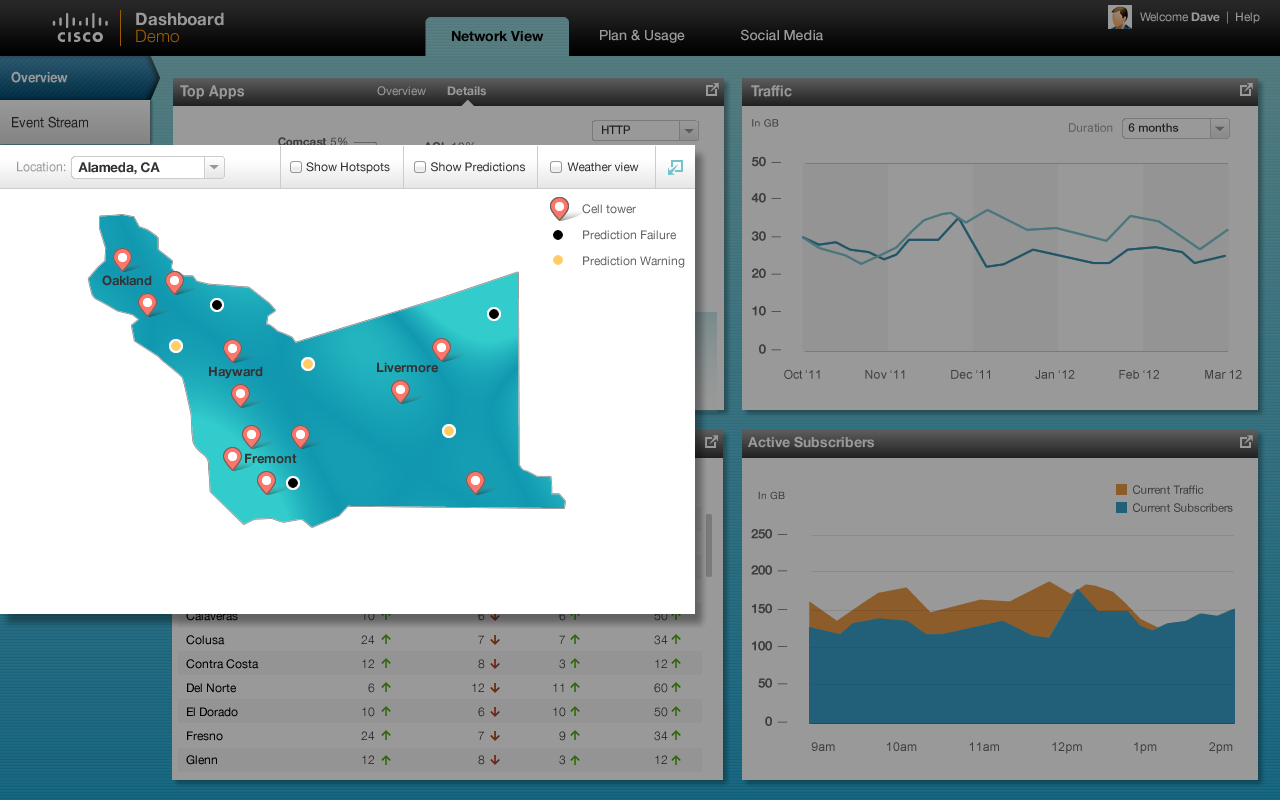
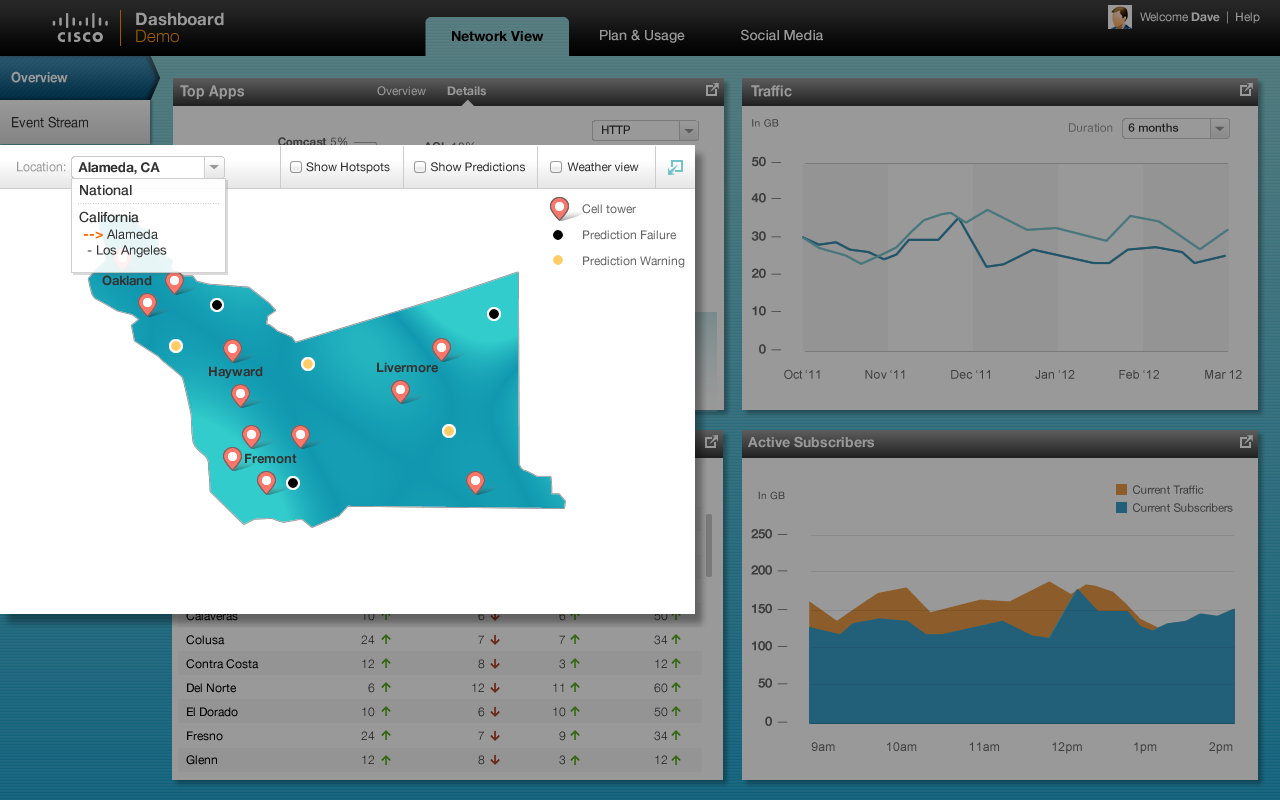
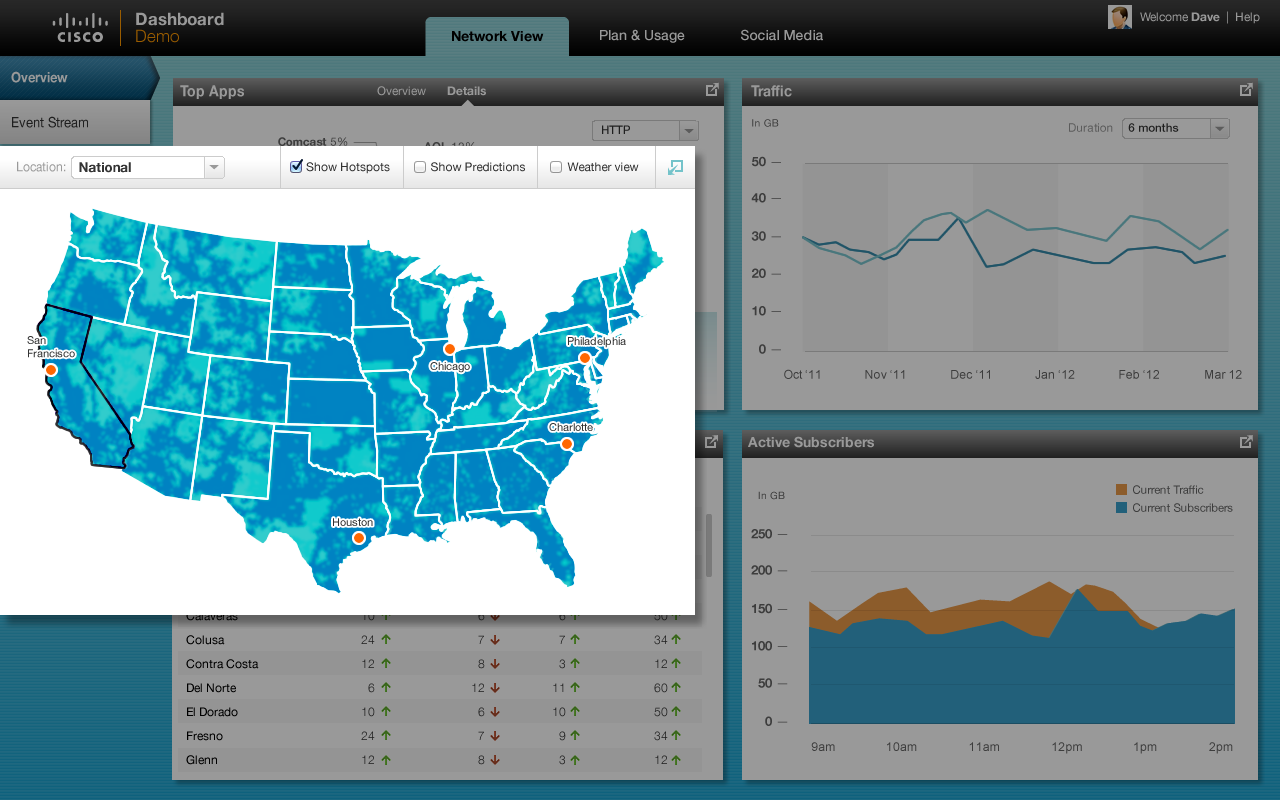
Show selectable map segments clearly at the National and State level and county level
Show the heat map at the National and State level, if its visually pleasing
Add another layer that shows weather, on select. Extreme weather should match the network spots or vice versa (Non California areas)
Show a county level map of CA with clickable regions highlighted (one or two)
If the user clicks on the county we will explore two options:
Show the Google map representation that has user location, tower location and picture (to show the problem area)
If option a doesn’t gel, show zip code representation of the county
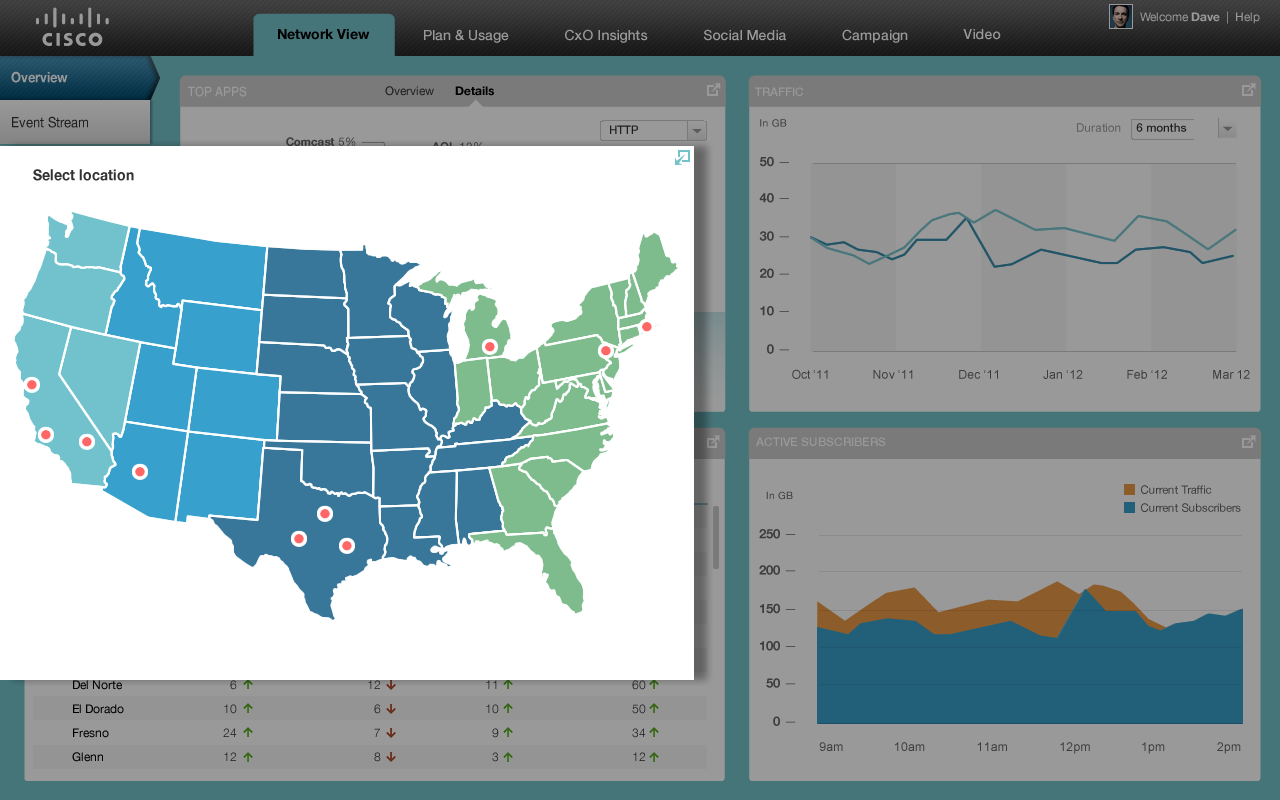
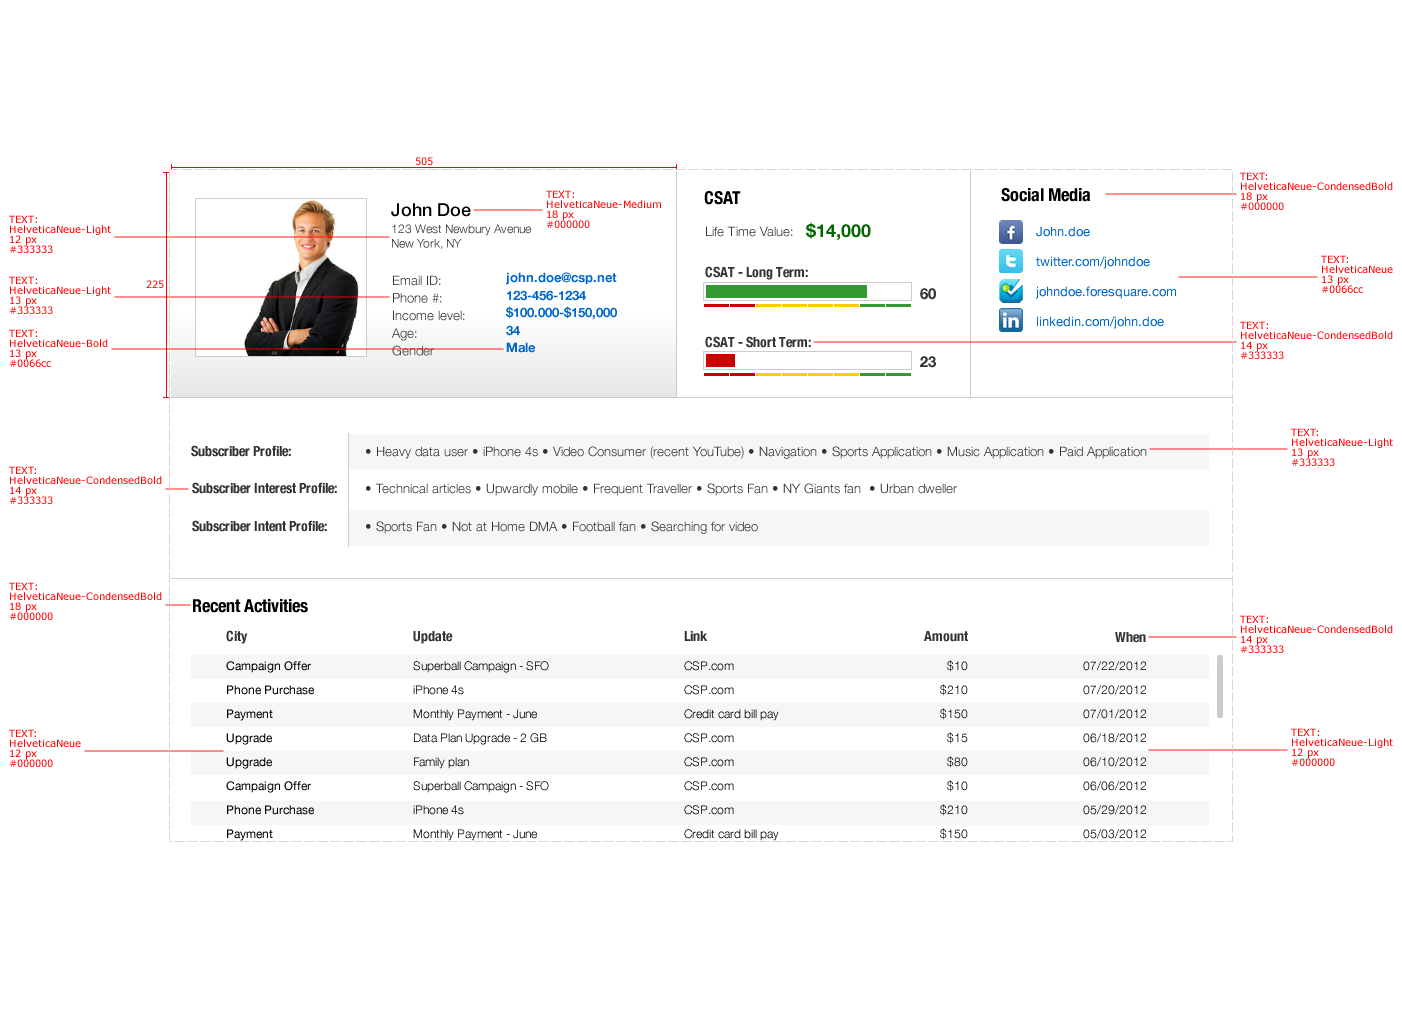
Final delivered designs